
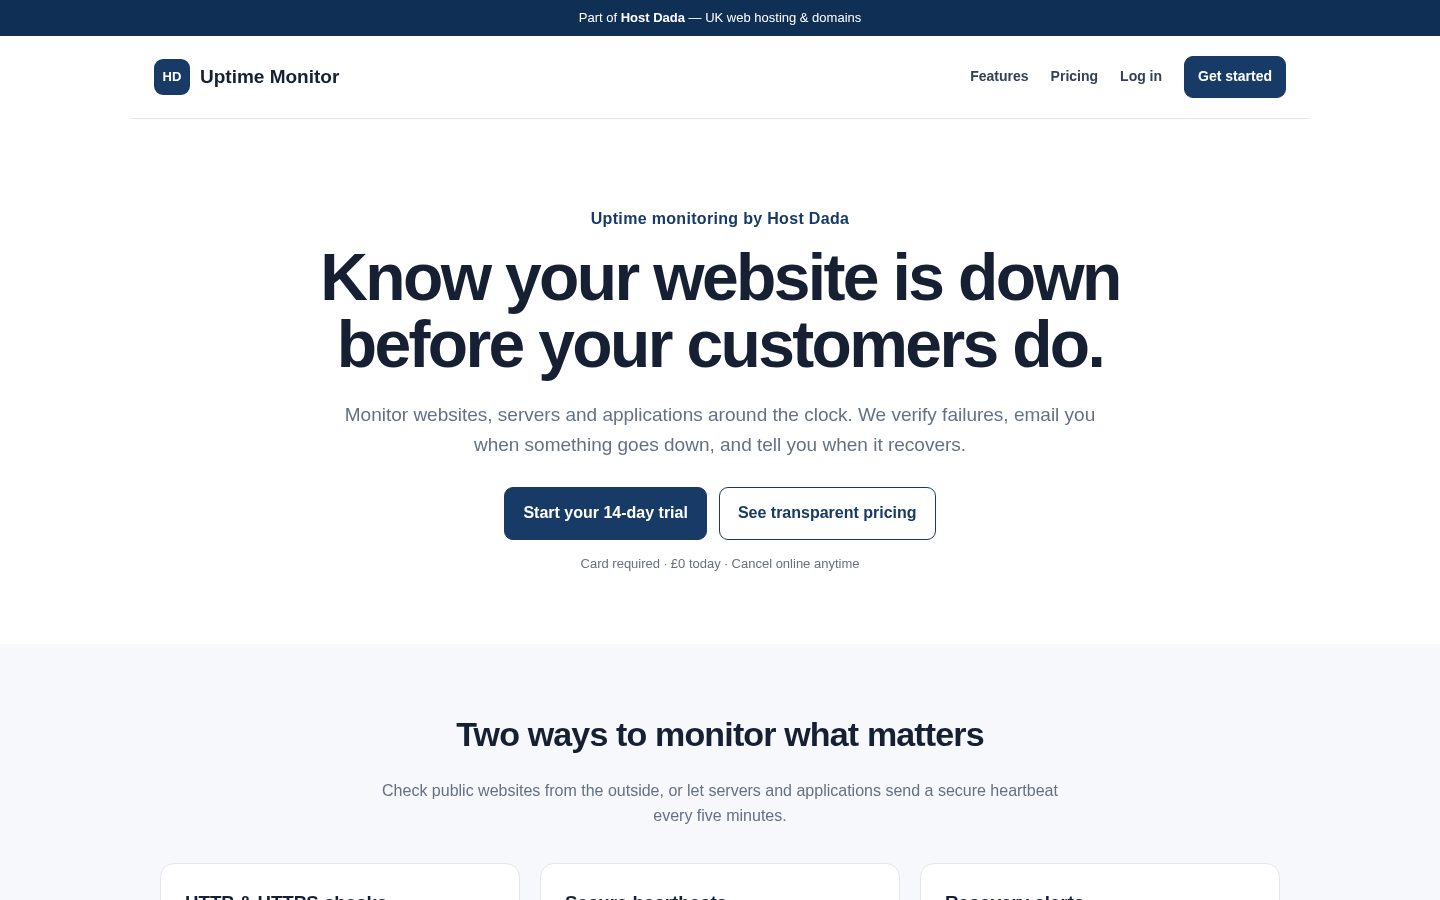
Host Dada Uptime Monitor – Turning an Infrastructure Requirement Into a Monitoring SaaS
Running hosting infrastructure means I don't want customers to be the ones who tell me something is down. So I built my own monitoring: website checks, server heartbeats, confirmed incidents with DOWN and RECOVERY alerts, and an independent watchdog that monitors the monitor. Then I turned it into a subscription product with plans, Stripe billing and administration. Designed, built and run by me.
Jump to a section
- Running hosting infrastructure changes how you think about downtime
- Two different questions
- Avoiding false alarms
- Who watches the watcher?
- "200 OK" doesn't always mean everything is OK
- From internal system to commercial product
- Operating the product
- A service that safely checks other people's addresses
- Technology that suits the environment
- What this project demonstrates
- I built it because I needed it
- Technical stack
Built with
- PHP
- MySQL
- Stripe
- WordPress
- Apache
- Linux
At a glance
What it is
uptime monitoring for websites, applications and servers, with email alerts when something goes down and when it recovers.
Where it came from
my own need to watch the hosting infrastructure I run through Host Dada.
Status
live as a Host Dada subscription product, with a 14-day trial.
Running hosting infrastructure changes how you think about downtime
Through Host Dada I host and manage websites and applications for other businesses. If one of them stops responding, the worst way to find out is from the customer.
If a customer's website goes down, I don't want them to be the person who tells me.
I wanted independent monitoring that gave me a clear picture of what was actually happening. Was the website unavailable? Was the application failing? Was the server underneath it still alive? And eventually: was the monitoring itself still working?
So I built my own monitoring platform.
Two different questions
A simple "ping the website" check only answers part of the question. The platform asks two different ones.
Is the service responding?
An HTTP or HTTPS check visits the website, application or health endpoint from the outside, every five minutes, the way a visitor would.
Is the server itself alive?
A heartbeat works the other way round: the server calls in to a secret address on a schedule. If the expected call stops arriving, the server — or the scheduled work it should be running — has gone quiet.
Together they tell you much more than either alone. If the application check fails but the heartbeat keeps arriving, the server is alive and the application is broken. If both go quiet, the problem is the server or its network. That is the difference between knowing something is wrong and knowing where to look.
Avoiding false alarms
A single failed request doesn't mean an outage. Networks have brief hiccups, and an alert that cries wolf soon gets ignored.
Before a website is recorded as down, the check tries again after a few seconds, and again after a few more. Only a failure that survives all three attempts opens an incident and sends the DOWN email. When the service answers again, the incident is closed and a RECOVERY email follows, so the alert trail always ends.
Heartbeats work the same way with a grace window: a late call is allowed a margin before it counts as missing. Every check, its response time and every incident are recorded, so each monitor has its own uptime, response-time and incident history, and alerts can go to several email addresses at once.
Who watches the watcher?
A monitoring platform can't assume it is always working. If it goes down, it obviously can't use itself to tell anyone.
So there is a second, much smaller program — a watchdog — running on one of my own servers, separate from the hosting the monitor runs on. Every five minutes it asks the monitor a simple question: are you healthy? If the answer is wrong or doesn't come at all, the watchdog sends its own alert, and where practical it uses a different email route from the monitor, so one failure can't silence both.
"Healthy" means more than the website answering. The monitor reports whether its database is reachable and whether its two checking workers — one for websites, one for heartbeats — have actually run recently. A monitor whose page loads but whose checks have quietly stopped is reported as unhealthy, which is exactly the failure that would otherwise go unnoticed.
Layer 1 — the application
is the website or application responding? An HTTP or HTTPS check.
Layer 2 — the server
is the machine underneath still alive? A heartbeat.
Layer 3 — the monitoring platform
is the system watching everything else still alive? The independent watchdog.
Monitoring only works if the monitor itself is being monitored.
"200 OK" doesn't always mean everything is OK
A web server can answer successfully while serving the wrong thing: a blank page, an error screen from a broken plugin, a parking page, or a different site altogether. To a simple check, all of those look fine.
Each account has its own site key. A monitored page can carry a small Host Dada tag containing that key, and a monitor can be set to require it. The check then reads the start of the page and confirms the tag is there; if it's missing, the site is treated as down.
It doesn't check every word on the page. What it does confirm is that the page being served is your site, carrying your tag, rather than something else answering in its place.
A WordPress plugin to do it for you
Many Host Dada customers run WordPress, so there is a small plugin, downloadable from the product, that adds the tag to every page. Paste in the site key, tick the option on the monitor, and a white screen or a broken theme now triggers an alert instead of passing as "up".
Solving the problem properly took more than one piece of software: the monitoring service, a WordPress integration and the servers underneath working together.
From internal system to commercial product
The requirement came from running Host Dada. But the same question — "how do I know before my customers do?" — applies to any business, developer or agency with a website. So the internal system became a product.
Accounts and plans
For the business: anyone can sign up, start a 14-day trial, add monitors and manage everything from their own dashboard. Plans differ by how many monitors they include, from a handful for one business to a hundred for an agency. Current plans are on the product's pricing page.
Under the hood: plans are real entitlements, defined in one place. The trial is offered to first-time subscribers only, and checks only run for accounts with an active subscription or trial.
Upgrades and downgrades handled automatically
For the business: customers can move between plans themselves. If someone downgrades to a plan with fewer monitors, the newest monitors above the new limit are paused rather than deleted; if they upgrade again, the paused monitors resume.
Under the hood: the limit is re-applied every time Stripe reports a change to the subscription, so the account always matches what is being paid for without anyone intervening.
Billing without manual work
For the business: Stripe Checkout for signing up, and Stripe's Customer Portal for changing plan, updating a card or cancelling. Prices are created in Stripe from the product's own plan list, and existing subscribers keep the price they signed up on.
Under the hood: subscription changes arrive through Stripe's webhooks, whose signatures are verified before anything is applied. A failed payment is reflected in the account automatically, and a late message about an old subscription can't cancel a customer's newer one. Card details never pass through or stay in the application.
Two purposes, one platform
For the business: the product still does its original job. My own infrastructure monitors run on the same platform as customers' monitors, but outside any commercial plan, so watching Host Dada's servers never competes with a customer's allowance.
Under the hood: admin accounts are exempt from subscription checks and effectively unlimited, while every customer account is held to its plan.
Operating the product
A protected super-admin area gives me the view an operator needs: customers and their subscriptions, trials, every monitor on the platform, a platform-wide incident log, and system health — the database and the timestamps showing when each checking worker last ran.
So the application doesn't only watch other systems. It shows whether its own critical processes are working, and the independent watchdog watches that from the outside.
A service that safely checks other people's addresses
A monitoring service connects to whatever addresses its customers give it, which is exactly why it needs care: an address could point at the monitor's own internal network instead of a public website.
Public addresses only
monitors accept only http and https addresses, and every address a site resolves to must be on the public internet, or the check is refused.
Unguessable heartbeats
each heartbeat address uses a long random secret, so nobody can fake a server's "I'm alive".
Accounts and forms
passwords are properly hashed, and every form that changes something is protected against cross-site requests.
Out of public reach
configuration, code, storage and the workers sit outside the public web folder.
Technology that suits the environment
This is a deliberately straightforward stack: PHP, MySQL, cURL and scheduled tasks. It is built to run within a traditional hosting environment, the kind Host Dada provides, with the watchdog small enough to run anywhere PHP does.
Some of my products are Next.js applications with React front ends. This one didn't need to be. A monitoring service needs to be dependable and easy to run in more than one place, and the choice of technology followed that requirement rather than habit.
Every check is kept for 400 days. Today that drives each monitor's history; the same records are what longer-range reports and status pages can be built on later.
What this project demonstrates
Operational experience
it exists because I run hosting infrastructure and needed it.
Systems thinking
application, server and monitoring platform each watched, with failures confirmed before anyone is woken up.
Product thinking
an internal tool turned into a self-service subscription product without losing its original purpose.
Commercial engineering
trials, plan entitlements, upgrades, downgrades and billing that run without manual work.
I built it because I needed it
Host Dada Uptime Monitor wasn't a portfolio exercise. I run hosting infrastructure and wanted better visibility of the websites, applications and servers I'm responsible for, so I built the system I wanted to use myself.
Once it existed, the question was whether the same capability could help other businesses, developers and agencies. That meant customer accounts, subscription plans, billing, entitlements, administration and self-service — and the result still does its original job alongside its customers'.
Visit Host Dada Uptime Monitor
Technical stack
PHP 8 and MySQL with cURL and scheduled workers, Stripe Checkout, Customer Portal and signed webhooks, a WordPress plugin for page-tag verification, and a standalone PHP watchdog on a separate Apache server, deployed on standard shared hosting with scheduled tasks.
Gallery
Project Links
Let's Work Together
Ready to Build Something Remarkable?
Whether you need a bespoke website, a full digital marketing strategy or a technical partner who understands business, I'm here.